
Chart
Create dynamic charts
Complexity: Advanced - requires extensive knowledge of JSON and data structures.
Introduction
The Chart binding lets you insert dynamic chart data into an existing chart in your recipe.
It’s useful when you want to automatically generate charts, such as bar, line, or pie charts, based on data provided from specific data structures.
This binding updates a chart that already exists in the template with new data, while keeping the chart’s style, colors, and formatting intact.
Chart binding overview
The Chart binding replaces the data of a chart that’s already present in your template.
To work correctly, the content control must surround either the entire chart or the chart’s anchor point.
You can use this binding with most common Microsoft Word chart types, including column, bar, line, area, and pie charts.
However, some chart types are not supported by the basic Chart binding:
- Box and Whisker
- Funnel
- Sunburst
- Treemap
- Waterfall
For these chart types, use the Extended chart binding instead.
When adding a Chart binding in a recipe through the binding editor, the following dialog is shown:
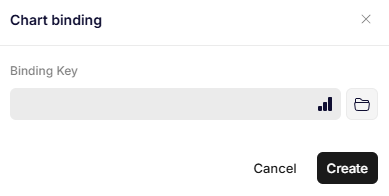
Chart binding
Parameters
Binding Key
Specifies the JSON path to the object that contains the chart data.
This object must follow a specific chart data structure so the binding can populate the chart correctly.
Updated 8 months ago