
Extended chart
Dynamically generate complex charts
Complexity: Advanced - requires extensive knowledge of JSON and data structures.
Introduction
The Extended chart binding lets you insert dynamic chart data into charts that aren’t supported by the standard Chart binding.
Use this binding when working with more complex or specialized chart types that require an extended data structure.
Supported chart types include:
- Box and Whisker
- Funnel
- Sunburst
- Treemap
- Waterfall
This binding provides full flexibility for these advanced charts but requires a correct JSON data model that matches the expected chart structure.
Extended chart binding overview
The Extended chart binding inserts chart data into an existing chart in your recipe.
Like the standard Chart binding, the content control must surround either the chart itself or the chart’s anchor point.
The provided chart data must follow a specific structure that defines categories, series, and nested values depending on the chart type.
Because the structure varies by chart type, it’s important to ensure your data matches the requirements for your chosen chart style.
When adding a Extended chart binding in a recipe through the binding editor, the following dialog is shown:
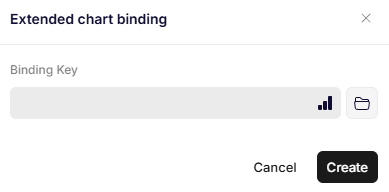
Extended chart binding
Parameters
Specifies the JSON path to the object that contains the chart data.
The JSON object must follow the required data model for the specific chart type being used.
A simplified example might look like this:
{
  "ChartDataPath": {
    "Categories": ["Group A", "Group B", "Group C"],
    "Series": [
      {
        "Name": "Results",
        "Values": [5, 12, 8]
      }
    ]
  }
}
For charts like Treemap or Sunburst, the structure can include nested objects to represent hierarchical relationships:
{
  "ChartDataPath": {
    "Root": {
      "Name": "Total",
      "Children": [
        {
          "Name": "Category 1",
          "Value": 40,
          "Children": [
            { "Name": "Subcategory 1.1", "Value": 25 },
            { "Name": "Subcategory 1.2", "Value": 15 }
          ]
        },
        {
          "Name": "Category 2",
          "Value": 60
        }
      ]
    }
  }
}
Updated 8 months ago